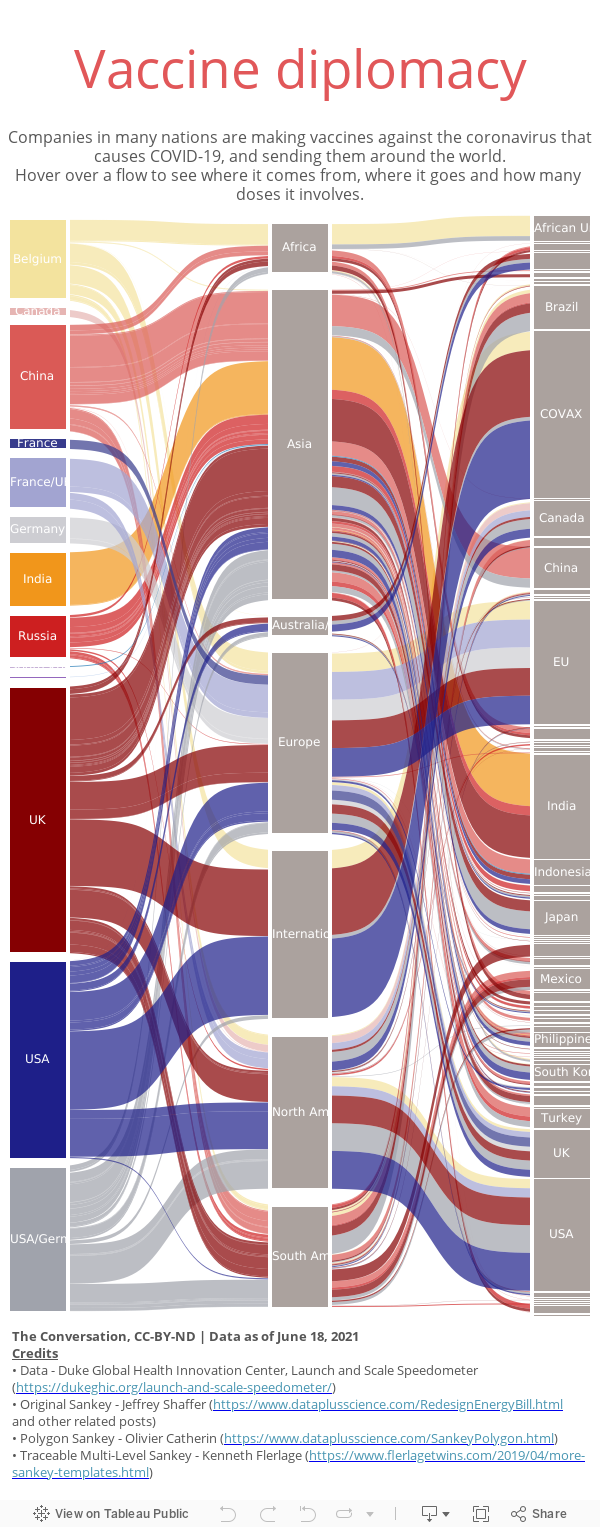
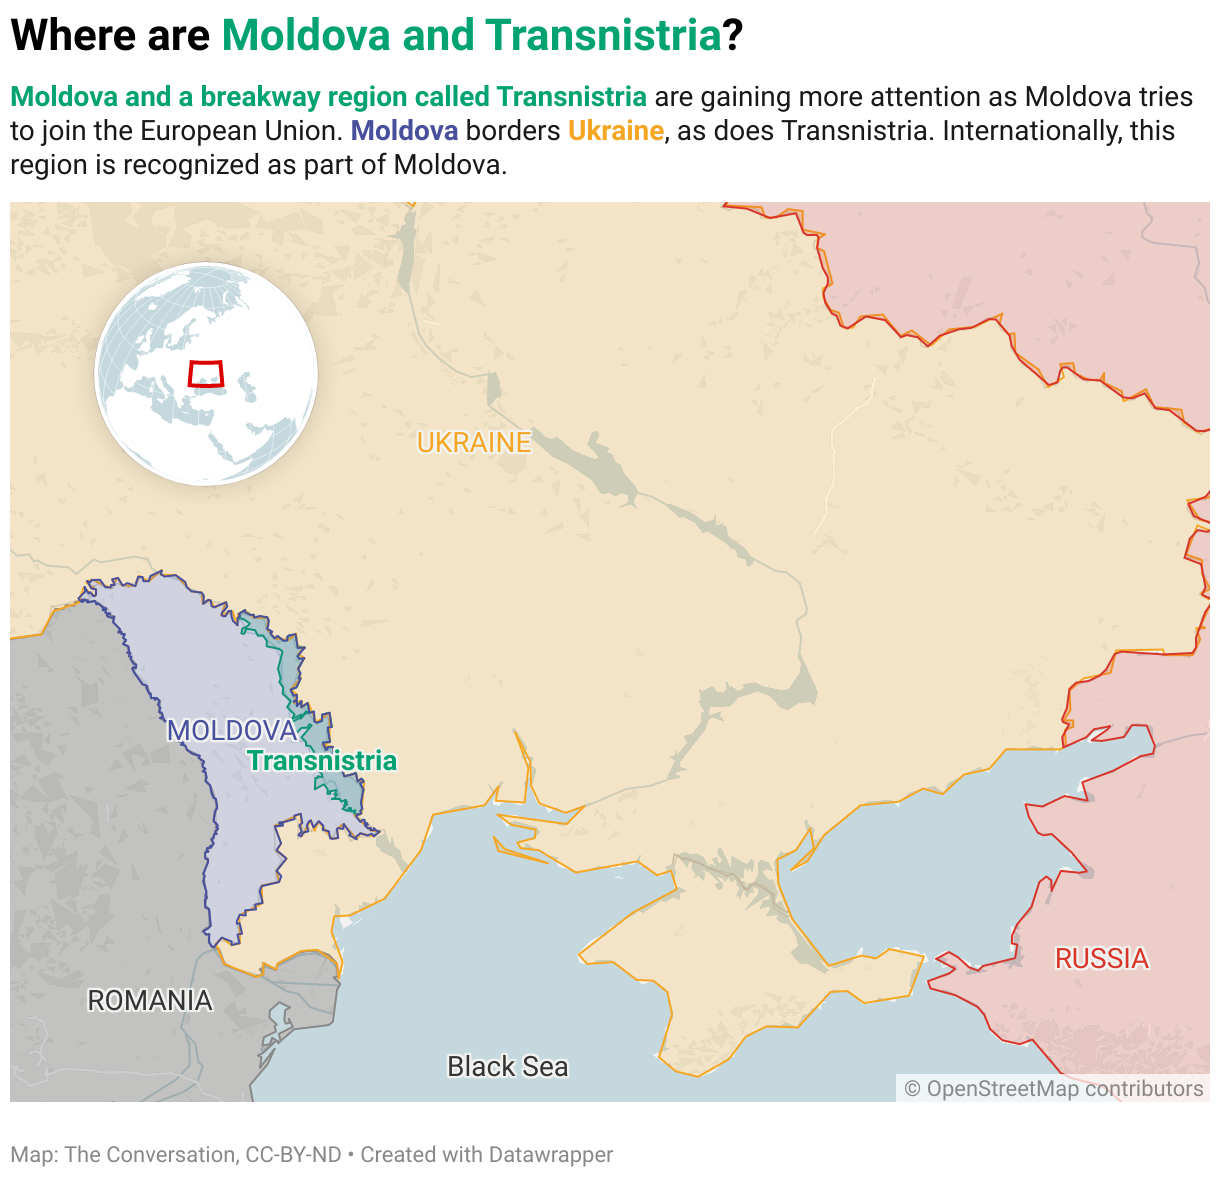
My favorite visualizations are those that reveal something otherwise hidden or hard to see -- and I've found ways to do that with bar and area charts, Gantt charts, Sankey charts, and various types of maps. It's also very important to me to use the capabilities of online visualizations to provide additional context and data, beyond the initial message of the viz, for those who wish to dig deeper. So please mouse over and click on the vizzes below to see what else is there!
Jeff Inglis
Editor, Researcher, Data Wrangler
My data visualizations portfolio
I've worked with Flourish, Tableau and Datawrapper. I enjoy exploring the options each platform has to offer for visualization, as well as their different preferences for editing the available data into a useful presentation. Here are some sample visualizations I've created with each of those platforms.
Subscribe to:
Posts (Atom)